Featured Projects
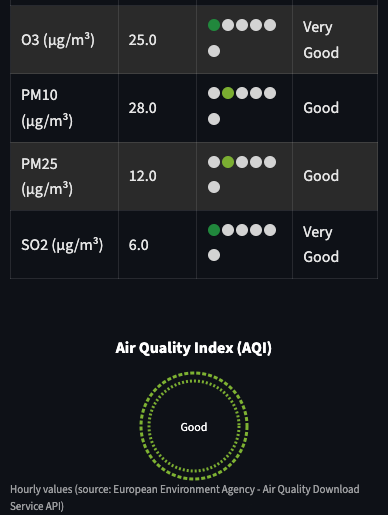
Air Quality Monitoring - Thessaloniki
An end-to-end Air Quality DataOps pipeline that collects, transforms, and predicts pollutant concentrations in Thessaloniki, Greece. Uses open data from the European Environment Agency and meteorological sources, with interactive visualizations for pollutants and weather variables.
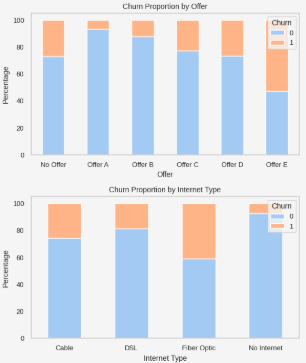
Customer Churn Prediction
A machine learning project analyzing IBM’s Telco dataset.

Google Analytics Data Analysis (BigQuery)
SQL-based exploration of e-commerce user behavior using Google Analytics data in BigQuery.

SQL Job Market Analysis
Analysis of the Data Analyst job market in the UK to identify the most in-demand and highest-paying skills.
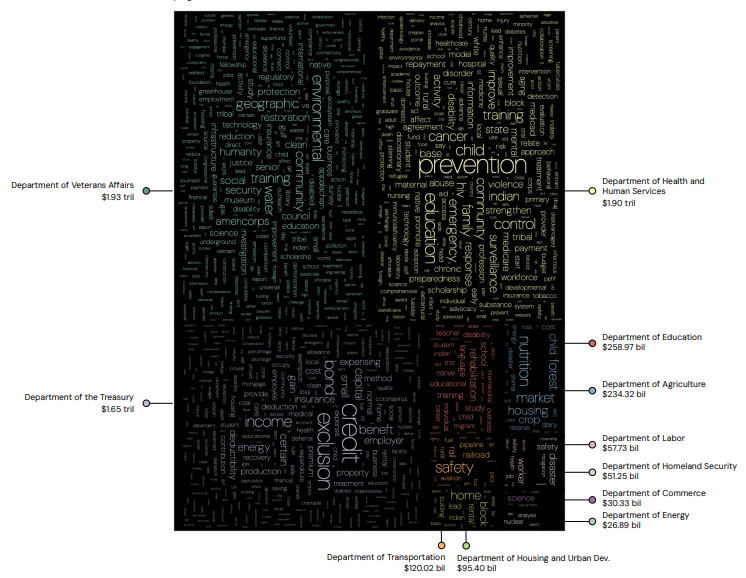
U.S. Federal Funding Freeze Visualization
A thematic visualization focusing on funding distribution within U.S. federal departments, highlighting key topics across programs.
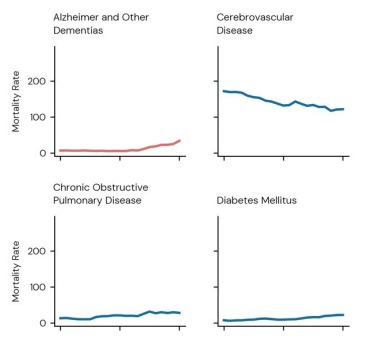
Mortality Rates by Disease in Greece
Analysis of WHO data to explore long-term mortality trends across major causes of death in Greece.
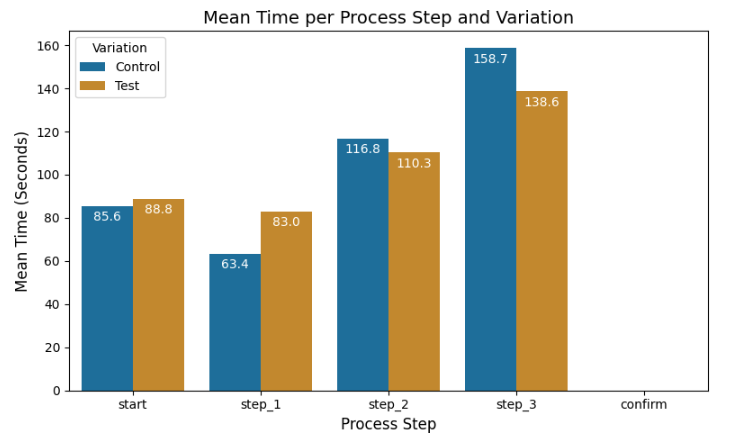
Vanguard A/B Testing
Statistical analysis of an A/B test comparing two user experience designs for completion rates, engagement, and efficiency.
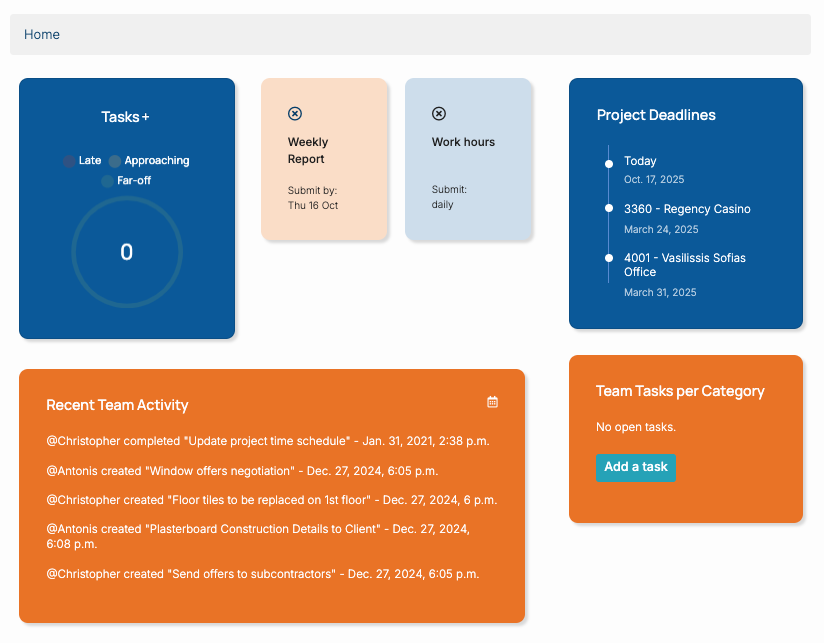
Follo Task Management App
A web-based task management app built with Django for tracking and organizing team workflows.
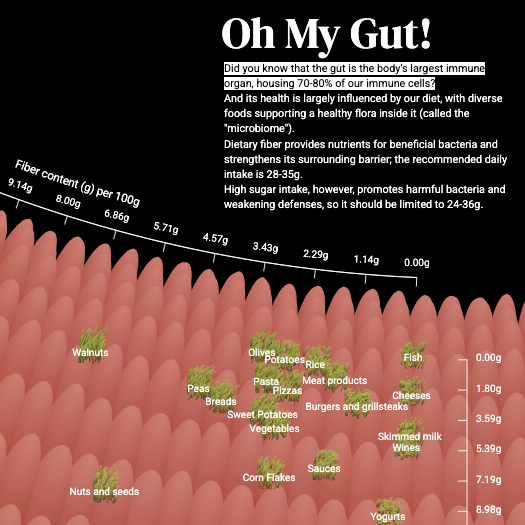
Fiber Content Graph
Interactive D3.js visualization illustrating fiber and sugar content in foods, highlighting gut health relationships.
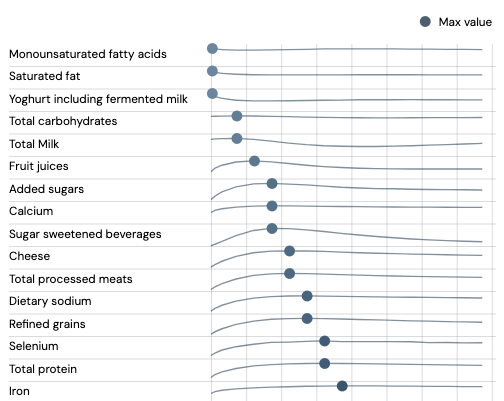
Dietary Factors & Age
Chart illustrating dietary intake trends across different Greek age groups.

Population Density Map of Greece
Interactive map visualizing Greece’s population density using H3 hexagonal grid data from the Kontur Population dataset (2023).
Caretta Caretta Occurrences in Greece
Mapping project visualizing Caretta caretta turtle occurrences across Greece using environmental data pipelines.
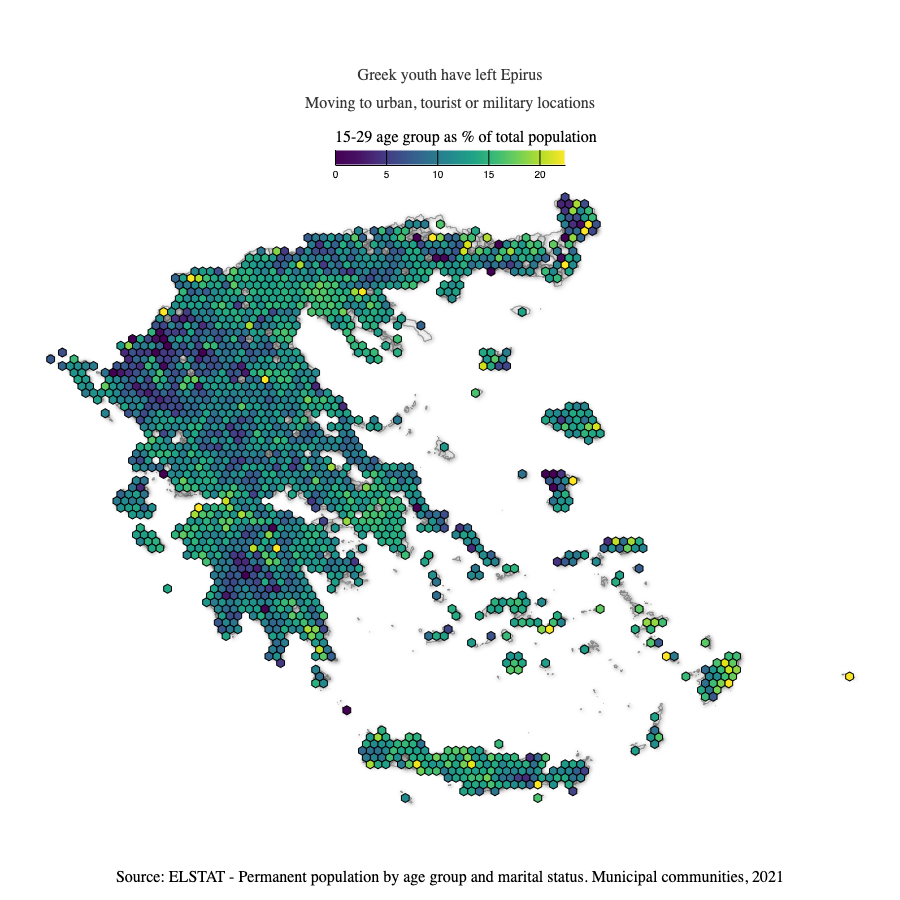
A Greek youth ratio Hexbin map
A hexbin map showing the ratio of the 15-29 age group to the total population in Greek municipal units.
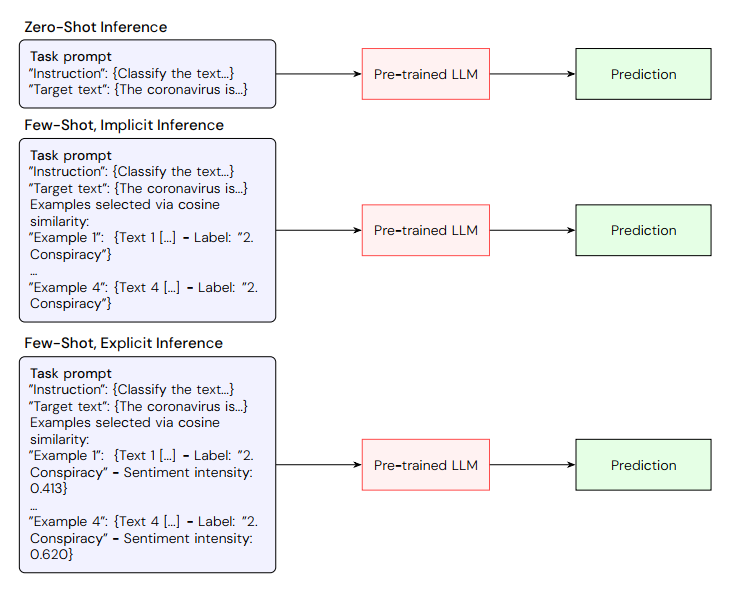
An extension to RAEmoLLM - Affective Misinformation Detection Framework
A retrieval-augmented generation framework using emotional cues and in-context learning to detect cross-domain misinformation. Extended the original RAEmoLLM framework for misinformation detection by combining sentiment valence and certainty scores.

The Effect of Behavioural Biases on Financial Decisions
A catalogue of 44 biases across three major categories, in line with the taxonomy proposed by David Peon and Manel Antelo, including some examples from daily life for each.